


Ben Dicken on X: “You asked for it, so here it is. Visualizing CPU cache speeds relative to RAM. Cache optimization is important too!”
Posted by jpluimers on 2025/03/18
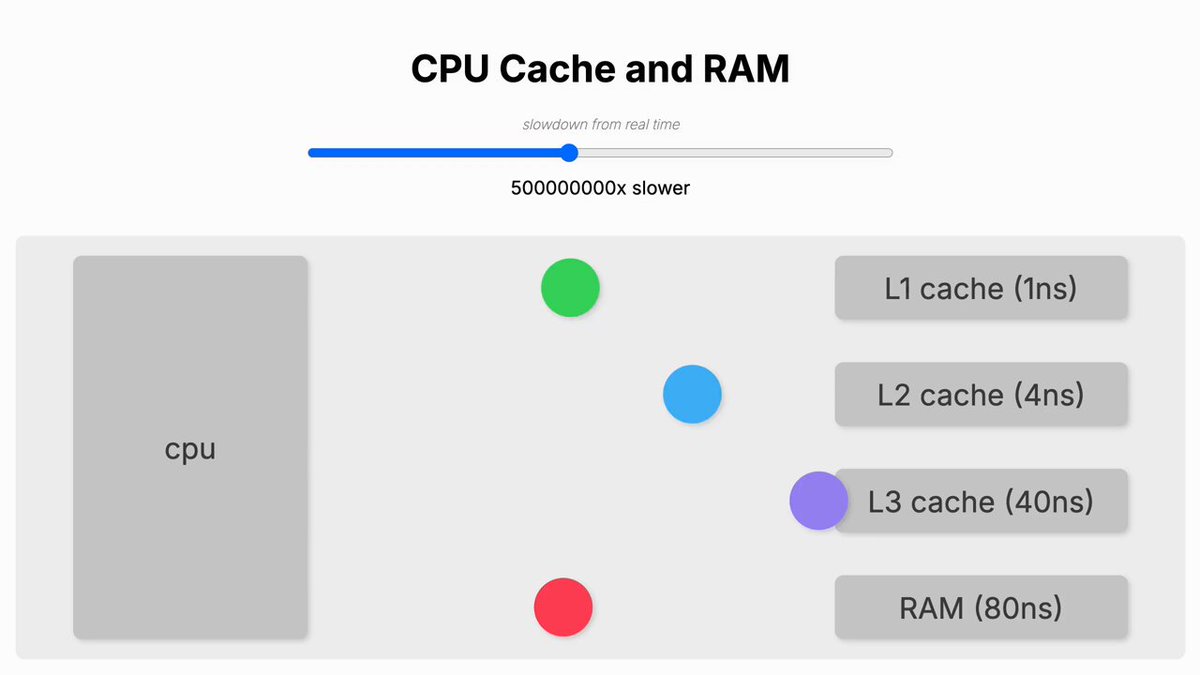
CPU Cache and RAM performance slowed down many magnitudes for better comparison
[WaybackSave/Archive] Ben Dicken on X: “You asked for it, so here it is. Visualizing CPU cache speeds relative to RAM. Cache optimization is important too!”
Cover .jpg: [WaybackSave/Archive] Bo3x-4alnGEqj-1I.jpg (1200×675).
The graph was made using [Wayback/Archive] GitHub – d3/d3: Bring data to life with SVG, Canvas and HTML. :bar_chart::chart_with_upwards_trend::tada:.
The underlying data is from [Wayback/Archive] Memory Performance in a Nutshell.
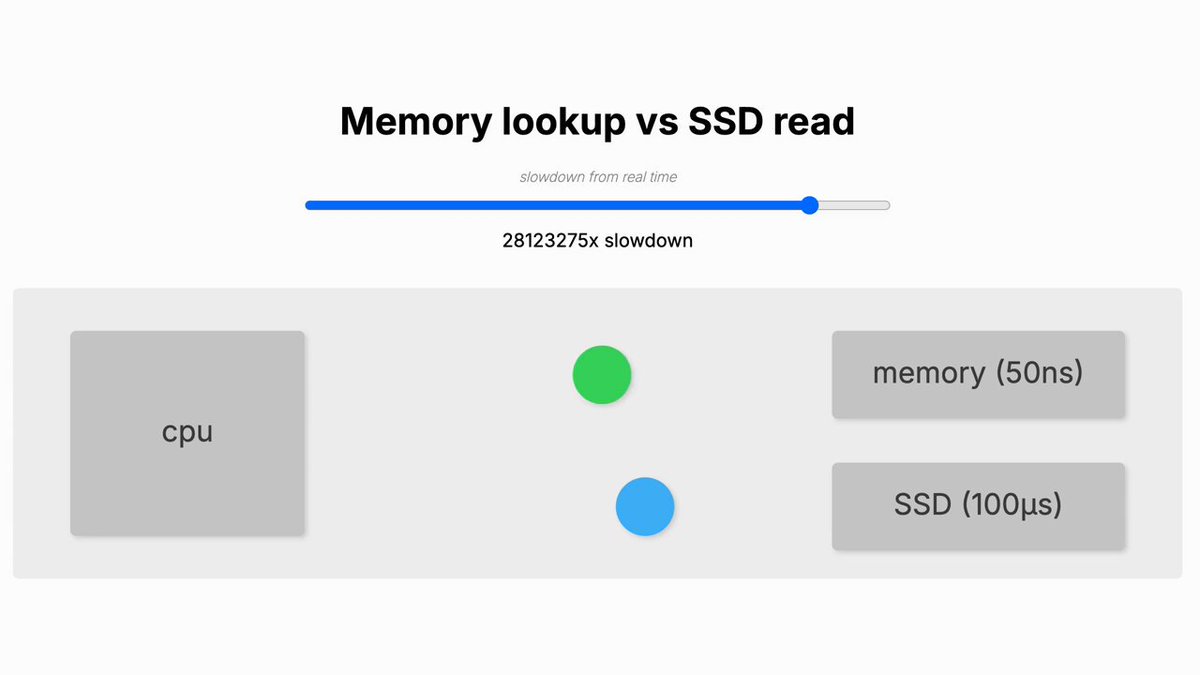
It was kind of a follow-up on a similar animation for Memory lookup versus SSD read speed (links at the end of this blog post)
Videos via [WaybackSave/Archive] Tweet JSON:
- [WaybackSave/Archive] video.twimg.com/ext_tw_video/1847309604436516864/pu/vid/avc1/480×270/6GArYwXZ6QFi8yuM.mp4
- [WaybackSave/Archive] video.twimg.com/ext_tw_video/1847309604436516864/pu/vid/avc1/640×360/MIu0gkdnCUXeBgZT.mp4
- [WaybackSave/Archive] video.twimg.com/ext_tw_video/1847309604436516864/pu/vid/avc1/1280×720/xc57wNeBOBjJ9RWc.mp4
I thought the source would have been [Wayback/Archive] Peter Norvich: Teach Yourself Programming in Ten Years – approximate timing for various operations on a typical PC.
But others suggested Brendan Gregg, so here are some materials from him:
- [Wayback/Archive] https://www.brendangregg.com/Slides/QCon2015_Broken_Performance_Tools.pdf
- [Wayback/Archive] CPU Utilization is Wrong via [Wayback/Archive] Gregg: CPU Utilization is Wrong [LWN.net]
Brendan Gregg asserts that CPU utilization is the wrong metric to be looking at when tuning a system. Much of the time when the CPU appears to be busy, it’s actually just waiting for memory. “The key metric here is instructions per cycle (insns per cycle: IPC), which shows on average how many instructions we were completed for each CPU clock cycle. The higher, the better (a simplification). The above example of 0.78 sounds not bad (78% busy?) until you realize that this processor’s top speed is an IPC of 4.0. This is also known as 4-wide, referring to the instruction fetch/decode path. Which means, the CPU can retire (complete) four instructions with every clock cycle. So an IPC of 0.78 on a 4-wide system, means the CPUs are running at 19.5% their top speed. The new Intel Skylake processors are 5-wide.”
Related blog posts:
- Pricetracker/-watch/-drop alters/-history charts for Newegg.com, Amazon.com, Best Buy, BackCountry.com, Zzounds.com
- Insightful : SE-Radio Episode 225 Brendan Gregg on Systems Performance by…
- Latency Numbers every Programmer and Architect should know
- Scaling, automatically and manually – The Isoblog.
- a perf cheat sheet from @brendangregg’s fantastic web page; you can print it as PDF
Memory lookup vs SSD read
Related tweet:
[WaybackSave/Archive] Ben Dicken on X: “Did you know that a random SSD read is multiple orders of magnitude slower than a random memory read? I made a little visual that really drives the point home. This is why memory buffers and caches are so important, especially for I/O heavy workloads like databases.”
Cover .jpg: [WaybackSave/Archive] G3awxD3zXhW_wAC8.jpg (1200×675)
The underlying data is from [WaybackSave/Archive] GitHub – sirupsen/napkin-math: Techniques and numbers for estimating system’s performance from first-principles.
Videos via [WaybackSave/Archive] Tweet JSON:
- [WaybackSave/Archive] video.twimg.com/ext_tw_video/1846584691970940929/pu/vid/avc1/480×270/X2n8YOFvUjaFTslq.mp4
- [WaybackSave/Archive] video.twimg.com/ext_tw_video/1846584691970940929/pu/vid/avc1/640×360/LZ9YLmYeQ-DgIXPL.mp4
- [WaybackSave/Archive] video.twimg.com/ext_tw_video/1846584691970940929/pu/vid/avc1/1280×720/GavMg3VQ2ouHTW18.mp4
--jeroen


Leave a comment