


Delphi – Using FastMM4 part 3: wrong persistent field type (TSmallIntField or TWordField) when getting IsNull results in memory corruption
Posted by jpluimers on 2009/08/17
This is the third post in a series around using FastMM4.
The start of the series contains a listing of other posts as well and will be updated when new posts become available.
This particular case is about detecting memory overwrites like FastMM has detected an error during a FreeMem operation. The block footer has been corrupted..
Some of them are extremely hard to pin down, especially because there are usually two cases:
- Allocated memory that is too small to hold the data structure
- Free memory that still has a reference to it, which is used after it was freed
This post is on the first case.
A future post will handle an example of the last case.
This particular instance of the first case is about a QC entry that I posted a while ago; the error also appeared in the current project we are working on.
It only happens when you get the IsNull value of a TSmallIntField (1 byte sized field) or TWordField (2 byte sized field) when the underlying field is actually larger (for instance a TIntegerField – which covers 4 byte sized fields).
I posted a QC entry titled Easy to fix in VCL: Using wrongly sized TSmallIntField in stead of TIntegerField causes memory overwrite which hopefully gets addressed in a future Delphi version (post Delphi 2009).
(NB: If you try that example, note that the .dproj is for Delphi 2009 – you can delete it then it runs in almost any Delphi version starting with 5 or 6 – and that you need FastMM_FullDebugMode.dll to be in your .exe directory).
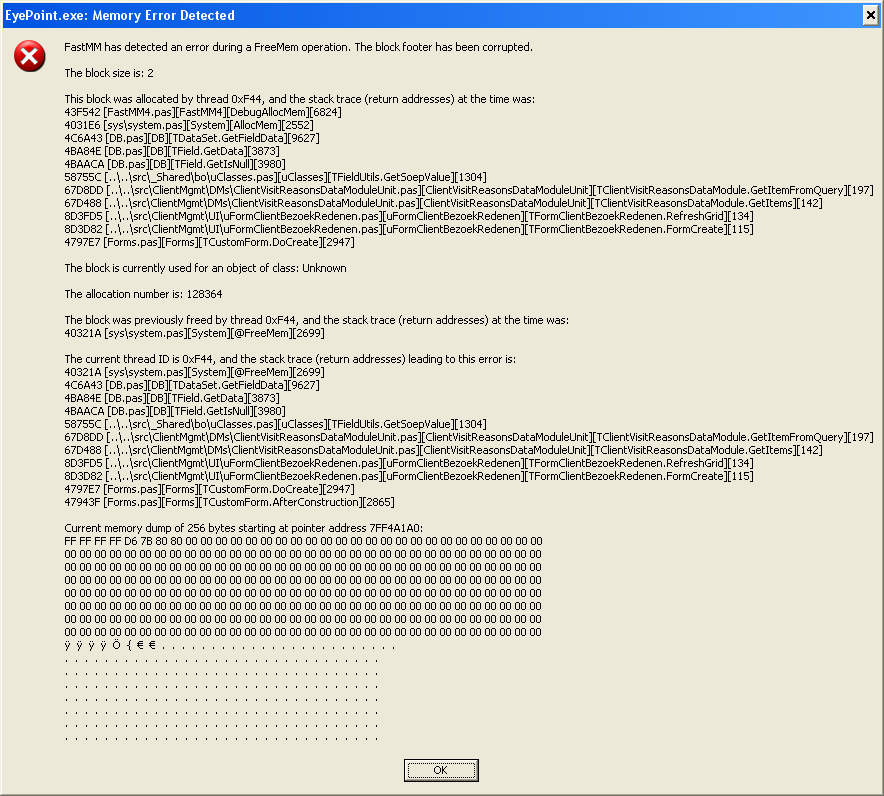
This is a part of the text version of the error message that includes the relevant stack trace:
--------------------------------2009/8/13 6:35:21--------------------------------
FastMM has detected an error during a FreeMem operation. The block footer has been corrupted.

The block size is: 2

This block was allocated by thread 0xF44, and the stack trace (return addresses) at the time was:
43F542 [FastMM4.pas][FastMM4][DebugAllocMem][6824]
4031E6 [sys\system.pas][System][AllocMem][2552]
4C6A43 [DB.pas][DB][TDataSet.GetFieldData][9627]
4BA84E [DB.pas][DB][TField.GetData][3873]
4BAACA [DB.pas][DB][TField.GetIsNull][3980]
58755C [..\..\src\_Shared\bo\uClasses.pas][uClasses][TFieldUtils.GetSoepValue][1304]
67D8DD [..\..\src\ClientMgmt\DMs\ClientVisitReasonsDataModuleUnit.pas][ClientVisitReasonsDataModuleUnit][TClientVisitReasonsDataModule.GetItemFromQuery][197]
67D488 [..\..\src\ClientMgmt\DMs\ClientVisitReasonsDataModuleUnit.pas][ClientVisitReasonsDataModuleUnit][TClientVisitReasonsDataModule.GetItems][142]
8D3FD5 [..\..\src\ClientMgmt\UI\uFormClientBezoekRedenen.pas][uFormClientBezoekRedenen][TFormClientBezoekRedenen.RefreshGrid][134]
8D3D82 [..\..\src\ClientMgmt\UI\uFormClientBezoekRedenen.pas][uFormClientBezoekRedenen][TFormClientBezoekRedenen.FormCreate][115]
4797E7 [Forms.pas][Forms][TCustomForm.DoCreate][2947]

The block is currently used for an object of class: Unknown

The allocation number is: 128364
[...]
The problem in tracking this down, is that there are multiple TDataSet.GetFieldData overloads, some of which call each other, and some of which are overridden in descendants.
If TDataSet.GetFieldData was part of your own code, then you could enable Stack Frames (as I explained in part 1 of the FastMM article series).
But TDataSet.GetFieldData is part of the VCL, and the VCL (even the debug .dcus!) are not compiled with Stack Frames enabled, so a stacktrace in FastMM does not always show you the complete list of functions being called.
Let me repreat, because it is important: If part of your .exe has nog been compiled with Stack Frame enabled – maybe because you only have .dcu files for a library – then you will not always see a complete stacktrace: the stacktrace might not include all functions being called!
That is yet another reason to get you complete source code for both the Delphi VCL and any 3rd libraries you are using.
Another problem is placing the breakpoint: TDataSet.GetFieldData is being called a lot, so placing a breakpoint there will make it fire many times.
In order to better zoom into it, I have extended FastMM4 a bit, on which I will write another article in the future.
In this case, I wrote a small reproduecable app (the one in QC) that would fire TDataSet.GetFieldData very little, so putting a breakpoint allowed me to trace into the memory allocation calls and find the actual cause.
In the end, it centralizes around this one in TDataSet:
function TDataSet.GetFieldData(Field: TField; Buffer: Pointer;
  NativeFormat: Boolean): Boolean;
var
  Temp: String;
  pBuff: PChar;
  NativeBuf: array[0..dsMaxStringSize] of Char;
begin
  if NativeFormat then
    Result := GetFieldData(Field, Buffer) else
  if Field.DataSize > dsMaxStringSize then
  begin
    SetLength(Temp, Field.DataSize);
    pBuff := pChar(Temp);
    Result := GetFieldData(Field, pBuff);
    if Field.DataType = ftString then
      SetLength(Temp, strlen(PChar(pBuff)));
    if Result then
      DataConvert(Field, pBuff, Buffer, False);
  end else
  begin
    Result := GetFieldData(Field, @NativeBuf);
    if Result then
      DataConvert(Field, @NativeBuf, Buffer, False);
  end;
end;
and the actual memory allocation done in a descendant:
function TCustomSQLDataSet.GetFieldData(Field: TField; Buffer: Pointer): Boolean;
var
FieldNo: Word;
TempBuffer: TValueBuffer;
ThisBuffer: TValueBuffer;
BlobSize: Int64;
BlobNull: LongBool;
begin
if not Self.Active then
DataBaseError(SDatasetClosed);
FieldNo := Field.FieldNo;
if not Assigned(Buffer) then
begin
if Field.IsBlob then
begin
if EOF then
BlobNull := True
else
FDBXReader.ByteReader.GetByteLength(Word(FieldNo)-1, BlobSize, BlobNull);
Result := not Boolean(BlobNull);
Exit;
end
else if Field.Size > Field.DataSize then
TempBuffer := TPlatformValueBuffer.CreateValueBuffer(Field.Size)
else
TempBuffer := TPlatformValueBuffer.CreateValueBuffer(Field.DataSize);
ThisBuffer := TempBuffer;
end else
begin
ThisBuffer := Buffer;
TempBuffer := nil;
end;
try
if Field.FieldNo < 1 then
Result := GetCalculatedField(Field, ThisBuffer)
else
Result := GetFieldData(FieldNo, ThisBuffer);
finally
if Assigned(TempBuffer) then
TPlatformValueBuffer.Free(TempBuffer);
end;
end;
[/sourcecode]
Now since the buffer is too small for the actual value, the underlying engine then copies over the end of the buffer, into the footer.
Because we use IsNull in a lager number of places, and the final error (an EAccessViolation) is very 'informative', we created the wrapper method below.
<a href="http://farm3.static.flickr.com/2430/3816660599_b8fc3c003b_o_d.png"><img class="alignright" src="http://farm3.static.flickr.com/2430/3816660599_b8fc3c003b_o_d.png" alt="" width="446" height="76" /></a>It gives error messages like this:
<pre>Invalid pointer operation (TSmallintField might be too small to hold the data for ClientVisitReasonsDataModule.SelectAllForClientQuerySOEP (SelectAllForClientQuery.SOEP))</pre>
The wrapper method thus also shows how to find the context description for a Field.
class function TFieldUtils.IsNull(const Field: TField): Boolean;
function GetDescription(const Field: TField): string;
var
DataSet: TDataSet;
DataSetOwner: TComponent;
begin
Result := Field.FieldName;
DataSet := Field.DataSet;
if Assigned(DataSet) then
begin
Result := Format('%s.%s', [DataSet.Name, Result]);
DataSetOwner := DataSet.Owner;
if Assigned(DataSetOwner) then
Result := Format('%s.%s (%s)', [DataSetOwner.Name, Field.Name, Result]);
end;
end;
begin
try
Result := Field.IsNull;
except
on E: EInvalidPointer do
begin
if (Field is TSmallintField) or (Field is TWordField) then
E.Message := Format('%s (%s might be too small to hold the data for %s)',
[E.Message, Field.ClassName, GetDescription(Field)]);
raise;
end;
end;
end;
Hope this helps you when you track down this kind of memory overwrites.
In future blog posts, you will see my FastMM4 extensions, and other examples of memory overwrites.
–jeroen


Lenin said
Hi Jeroen,
First of all I would like to congratulate and thank you for these very useful articles on FastMM4 usage.
I am using FastMM4 on a Delphi 7 application using RemObjects/DataAbstract sdk. The server application is composed of a main project and a set of DLLs where the services are implemented.
I followed the configuration to get the stack trace trace. Nevertheless, I have no detailed trace from DLL code.
To better understand the problem, I got the newest version of FastMM (4.94) and try to run de “Dynamically Loaded DLL” demo that cames in the zip file.
So, the same problem, no detailed stack trace for memory leaks caused by the DLL. as follow:
——————————–2009/9/29 14:41:58——————————–
A memory block has been leaked. The size is: 4
This block was allocated by thread 0x17FC, and the stack trace (return addresses) at the time was:
4000304B
4000574F
40005B46
40005784
108622F
1086200
12514DE
12416D5
12417C9
1251343
7E3799D8 [NotifyWinEvent]
The block is currently used for an object of class: Unknown
———
After check the project options to “build with runtime packages” I have some stack trace but does not indicates the source where the leak occurs, as follow:
——————————–2009/9/29 15:15:29——————————–
A memory block has been leaked. The size is: 4
This block was allocated by thread 0x15B4, and the stack trace (return addresses) at the time was:
4000304B [System][@GetMem]
4000574F [System][TObject.NewInstance]
40005B46 [System][@ClassCreate]
40005784 [System][TObject]
100622F
1006200
7114DE [Controls][TControl.Click]
7016D5 [Stdctrls][TButton.Click]
7017C9 [Stdctrls][TButton.CNCommand]
711343 [Controls][TControl.WndProc]
7E3799D8 [NotifyWinEvent]
The block is currently used for an object of class: TObject
The allocation number is: 611
I forgot to mention that I changed the demo to generate the DLL leak on a separated procedure (not in the button event).
How can I have stack trace with source/line number where the leak occurs in DLL code?
Thanks in advance.
jpluimers said
Interesting problem. Can you please contact me by email?
–jeroen