The Wiert Corner – irregular stream of stuff

Jeroen W. Pluimers on .NET, C#, Delphi, databases, and personal interests

  • My badges

  • Twitter Updates

  • My Flickr Stream

  • Pages

  • All categories

  • Enter your email address to subscribe to this blog and receive notifications of new posts by email.

    Join 4,262 other subscribers

Archive for the ‘Debugging’ Category

Skip line while debugging in Chrome developer tools – Stack Overflow

Posted by jpluimers on 2024/03/27

[Wayback/Archive] Skip line while debugging in Chrome developer tools – Stack Overflow (thanks [Wayback/Archive] Matas Vaitkevicius for both asking and answering):

Last comment from dev says:
We’re going to hold off on this feature for now. It’s complexity is high and it’s not common enough a workflow. One could also just comment out the lines and hit ctrl-s to get the same effect, pretty much. Status: WontFix –
The workaround is to comment out the line you want to skip and press Ctrl+S.

The problem is that the workaround fails when you have used the Chrome Dev Tools to format the source code: then you cannot edit the formatted code.

The workaround for that is cumbersome, but doable as in this bug report:

Read the rest of this entry »

Posted in Chrome, Debugging, Development, Google, JavaScript/ECMAScript, Power User, Scripting, Software Development, Web Development | Leave a Comment »

BitSavers added some more Borland documentation in 2022 (most relevant for me: Assembler, Debugger, Profiler)

Posted by jpluimers on 2024/02/28

Below is a list of the Borland documentation that BitSavers added in 2022, ordered by relevance to me (and how I finally asked Peter Sawatzki if he still had the monochrome TDVIDEO.DLL he wrote for Turbo Debugger 3.0 for Windows):

Read the rest of this entry »

Posted in 8087, Algorithms, Assembly Language, Borland C++, C, C++, Debugging, Development, Floating point handling, Profiling, Software Development, Turbo Assembler, Turbo C, Turbo Debugger, Turbo Profiler, x86 | Leave a Comment »

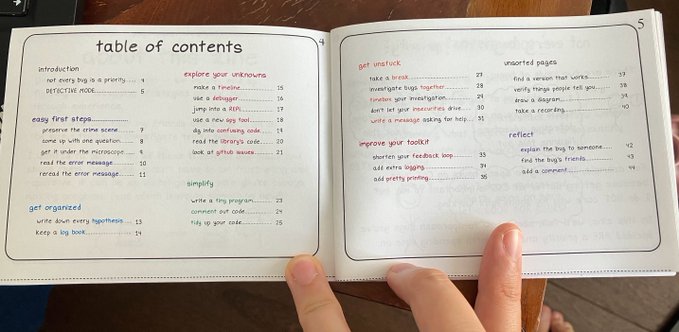
Be sure to leave a review for The Pocket Guide to Debugging by Julia Evans | Goodreads

Posted by jpluimers on 2023/02/21

Julia makes great books, so be sure to leave a review at [Wayback/Archive] The Pocket Guide to Debugging by Julia Evans | Goodreads

Via [Wayback/Archive] 🔎Julia Evans🔍 on Twitter: “if you read “The Pocket Guide to Debugging — I’d love it if you left a review on Goodreads! It helps a lot.”

–jeroen

Posted in Debugging, Development, Software Development | Leave a Comment »

Some links on thread names in Windows

Posted by jpluimers on 2021/07/01

For a very long time, it has been possible to name threads visible in debuggers: How to: Set a Thread Name in Native Code.

In the mean time, under Windows 10, you can both Get and Set the thread name. This brings native applications on par with with .NET where this has always been possible. Chrome uses these new API calls.

Which means I have some reading to do:

–jeroen

Posted in Debugging, Development, Software Development, Windows Development | Leave a Comment »

SEP92: A VIDEO COMPATIBILITY INTERFACE FOR TURBO DEBUGGER

Posted by jpluimers on 2020/11/26

[WayBack/Archive] SEP92: A VIDEO COMPATIBILITY INTERFACE FOR TURBO DEBUGGER

Blast from the past, which reminds me of the days that Peter Sawatzki used this interface to write a DLL that allowed Turbo Debugger for Windows (TDW) run on a secondary monochrome screen using a special TDVIDEO.DLL.

That way you could debug Windows applications without distorting the screens, highly speeding up the debugging process.

Lot’s of stuff from that era got never archived, so I wish I could have found it in my archive, but I seem to have lost it.

Found via:

–jeroen

Posted in Debugging, Development, Pascal, Software Development, Turbo Debugger, Turbo Pascal | Leave a Comment »