The Wiert Corner – irregular stream of stuff

Jeroen W. Pluimers on .NET, C#, Delphi, databases, and personal interests

  • My badges

  • Twitter Updates

  • My Flickr Stream

  • Pages

  • All categories

  • Enter your email address to subscribe to this blog and receive notifications of new posts by email.

    Join 1,835 other subscribers

Archive for the ‘Debugging’ Category

Laptop fan profiling, and debugging them – related to Profiling | CommitStrip

Posted by jpluimers on 2019/07/23

A while back, I posted the “profiling” CommitStrip on[WayBack] Profiling – Jeroen Wiert Pluimers – Google+. Boy how did I not know that within a week, I bumped into a “laptop fan profiling” artefact.

A coworker noticed, that when starting a thread based equivalent of [WayBack] TTimer Class (which cannot be used in services as it depends on the VCL), then sometimes the laptop fans would spin up.

What basically happened was that for certain combinations of Enabled and Interval the Execute would loop burning 100% of one CPU core.

With 3 or more – sometimes 2 – of these threads active on a 4+4 core (4 are hyper-threaded), the processor fan would start to spin like madness.

Finding the solution was somewhat easy too:

  • Process Explorer would show the thread IDs burning the most CPU cycles
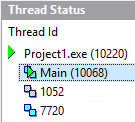
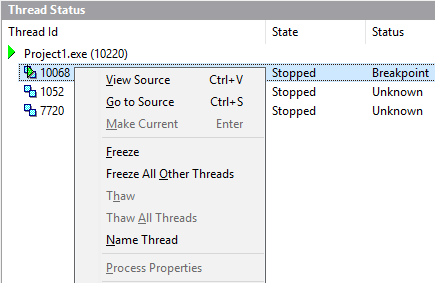
  • Delphi shows the Thread IDs in the Thread Status pane (if they are named, the ID is at the end of the name in parenthesis)
  • At around Delphi 2010, you can Freeze or Thaw threads. This allows you to debug only a single thread by freezing all others.

Focussing on one thread, allowed a close inspection of the loop, quickly finding the actual cause and repairing it.

TTimer Thread

A similar and better class is at [WayBack] multithreading – TTimerThread – Threaded timer class – Code Review Stack Exchange, based on [WayBack] timer – Using VCL TTimer in Delphi console application – Stack Overflow.

Read the rest of this entry »

Posted in Conference Topics, Conferences, Debugging, Delphi, Development, Event, Fun, Multi-Threading / Concurrency, Profiling-Performance-Measurement, Software Development | Leave a Comment »

gdbgui – browser based debugger for C, C++, go, rust, Fortran. Modern gdb frontend.

Posted by jpluimers on 2019/03/05

[WayBack] gdbgui – browser based debugger for C, C++, go, rust, Fortran. Modern gdb frontend.: gdbgui (gnu debugger graphical user interface)

Via: [WayBack] Browser-based debugger for C, C++, go, rust, and more – written in Python with Flask. https://github.com/cs01/gdbgui Easy installation via PyPI: pip i… – Joe C. Hecht – Google+

–jeroen

Posted in C, C++, Debugging, Development, Fortran, GDB, Go (golang), Python, Scripting, Software Development | Leave a Comment »

Hi there. Is it possible to get RTTI information for IDE “built-in” classes …

Posted by jpluimers on 2018/12/04

For my link archive: [WayBack] Hi there.Is it possible to get RTTI information for IDE “built-in” classes with an OTA Wizard?Let’s say I create a TRttiContext object in my wizard…. – Fl Ko – Google+

Here is an IDE explorer that helps: [WayBack] GitHub – DGH2112/Delphi-IDE-Explorer: A RAD Studio IDE wizard / expert / plugin that allows you to browser the internal fields, methods, properties and events of the IDE.

–jeroen

Posted in Debugging, Delphi, Development, Software Development | Leave a Comment »

Delphi call stack from exception…

Posted by jpluimers on 2017/08/02

Lars Fosdal:

MADExcept and Eurekalog are good products (and there is a JVCL tool as well). If you run your app in the IDE, you get the stack there – but for now, you need to acquire a third party package to get it runtime.I don’t disagree with the wish for a basic call stack tool, that works cross platform, but it would affect third party developers.

Stefan Glienke:

Whats the problem? You attach handlers to Exception.GetExceptionStackInfoProc, GetStackInfoStringProc and ` and just call a function that grabs the map or td32 info and generates the callstack – if you don’t want to spend any money for a high quality tool like madExcept (can even use it for free for non commercial use!) then use JclDebug.pas

I edited in some URLs above; the actual info is from: Why Delphi (like other developer environments) natively not included full call stack for every exception… [WayBack] (which is because it would kill even more of the Delphi 3rd party market).

And it taught me about this by madshi (of MADExcept fame):

DebugEngine is a collection of utils related to debug stuff (stack trace, CPU registers snaphot, debug info,…). Basically, I started to write a commercial error log plugin for Delphi, then I noticed that my internal framework got bigger and bigger. So I decided to share it with the community in hope it will be useful.

Source: MahdiSafsafi/DebugEngine: Delphi debug framework

And there is the JCL ExceptDlg.pas which is quite easy to use: just add it anywhere to your project and the global exception handler will show you a stack trace provided you have a .MAP file or .TDS file (which contains TD32 symbol information) in the same directory as your .EXE.

–jeroen

Example code:


unit ExceptionHelperUnit;
interface
uses
System.SysUtils;
type
ExceptionHelper = class helper for Exception
public
function Describe: string;
class procedure RaiseNotImplementedException(const aClass: TClass; const aMethodName: string);
class function GetStackTrace: string;
end;
implementation
uses
System.RTLConsts,
System.SysConst;
type
EStackTraceException = class(Exception); // EProgrammerNotFound to make it really clear this is only to be used in very limited places ??
{ ExceptionHelper }
function ExceptionHelper.Describe: string;
var
lStackTrace: string;
begin
Result := inherited ToString();
if Self is EInOutError then
if Result = System.RTLConsts.SInvalidFileName then
Result := System.SysConst.SInvalidFileName;
if Assigned(StackInfo) then
lStackTrace := StackTrace
else
lStackTrace := 'empty';
Result := Format('Exception'#13#10'%s at $%p: %s'#13#10'with StackTrace'#13#10'%s', [ClassName, ExceptAddr, Result, lStackTrace]);
end;
class function ExceptionHelper.GetStackTrace: string;
begin
try
Result := 'Get StackTrace via Exception.';
raise EStackTraceException.Create(Result) at ReturnAddress;
except
on E: EStackTraceException do
Result := E.StackTrace;
end;
end;
class procedure ExceptionHelper.RaiseNotImplementedException(const aClass: TClass; const aMethodName: string);
begin
raise ENotImplemented.CreateFmt('Method %s.%s is not implemented.', [aClass.ClassName, aMethodName]);
end;
end.

Posted in Debugging, Delphi, Development, MAP Symbol Information, Software Development, TD32/TDS Symbol information | 6 Comments »

When AQTime thinks it’s running during install and aborts installation

Posted by jpluimers on 2016/11/29

I had this warning (which is actually an error: you cannot continue as pressing OK would get you the same warning over and over again) during AQTime installation a while ago:

---------------------------
WARNING !
---------------------------
Setup has detected AQtime running on your computer. You must close the application and press OK to continue.

Press Cancel to abort installation.
---------------------------
OK   Cancel
---------------------------

Back then:

  1. I was Administrator
  2. The Installer download was from http://downloads.smartbear.com/AQtime.exe
  3. The embedded version was 8.50.1720
  4. It did successfully extract the AQtime.msi before bailing out

The fix (from SmartBear support) was remarkably simple, so I was surprised I could not find it online:

If your downloaded, saved AQtime installation package is named AQtime.exe, rename it: (ex: AQtime850.exe and you should then be able to complete the installation process.

So basically renaming AQTime.exe into AQTime850.exe allowed it to install.

–jeroen

Posted in Debugging, Development, Software Development | Leave a Comment »

CppCon 2015: Greg Law ” Give me 15 minutes & I’ll change your view of GDB” – YouTube

Posted by jpluimers on 2016/11/17

CppCon 2015: Greg Law ” Give me 15 minutes & I’ll change your view of GDB” – YouTube

via: Things you did not know about GDB – Kristian Köhntopp – Google+

–jeroen

Posted in Debugging, Development, GDB, Software Development | Leave a Comment »

Delphi – unmangle names in BPL’s – Stack Overflow

Posted by jpluimers on 2016/10/12

Check out $(BDS)\source\cpprtl\Source\misc\unmangle.c – it contains the source code for the unmangling mechanism used by TDUMP, the debugger and the linker. (C++Builder and Delphi use the same mangling scheme.)

This has been around as long as BCC itself. However the file was called um.c instead of unmangle.c in older versions

Source: [WayBackDelphi – unmangle names in BPL’s – Stack Overflow both by User Moritz Beutel.

It’s the same mangling used in the TD32/TDS and MAP symbols.

And neede to improve https://github.com/jpluimers/map2dbg (which is my fork of https://github.com/andremussche/map2dbg) which contrary to it’s name also supports TDS/TD32 conversions in tds2pdb. The code is C# and works in virtually any Visual Studio version of 2012 and younger.

–jeroen


Posted in Debugging, Delphi, Development, MAP Symbol Information, Software Development, TD32/TDS Symbol information | Leave a Comment »

SmartBear AQTime links

Posted by jpluimers on 2016/06/02

Since they’re hard to find on-line, and sometimes I need them when not having access to my collective browser or email history:

Notes:

  1. The AQTimeDemo.exe is the same as the latest AQTime###.exe (functionality depends in license).
  2. The installation from Windows Explorer sometimes fails with the below message. Installation from the command-prompt works, but you need to run it from an Administrator command-prompt:

---------------------------
E:\TEMP\AQtime824.exe
---------------------------
Windows cannot access the specified device, path, or file. You may not have the appropriate permissions to access the item.
---------------------------
OK
---------------------------

To get going for my special case, I watched some sample videos (which I did get to work in Internet Explorer but not in Chrome forty-something):

I needed it to do some profiling comparisons of services running under different configurations.

Read the rest of this entry »

Posted in .NET, Debugging, Delphi, Development, MAP Symbol Information, Profiling-Performance-Measurement, Software Development, TD32/TDS Symbol information, Visual Studio and tools | Leave a Comment »

Bug squasing: A heisenbug is not your average bug.

Posted by jpluimers on 2016/03/15

I took the liberty to make an English translation of this very interesting German story about squasing an Heisenbug from Kristian KöhntoppHeisenbugsquashing bei +SysEleven: Sechs Monate Kernels crashen, aber jetzt isser tot….

Don’t forget to read (translated) comments in the original thread. Very interesting read!

I agree it’s in the Heisenbug category given “Time can also be a factor in heisenbugs, particularly with multi-threaded applications.”.

Anyway, the translation and original:

English:

Read the rest of this entry »

Posted in Debugging, Development, Software Development | Leave a Comment »

Some notes/links on Windows Debugging CLR applications

Posted by jpluimers on 2014/07/02

I only need it every once in a while, so finding the right links and tips to help me usually takes too much time.

So here is a small list to get started:

Keywords: CLR, SOS.DLL, WinDbg, mscordacwks.dll, PSSCOR4

Some tips: Read the rest of this entry »

Posted in .NET, .NET 1.x, .NET 2.0, .NET 3.0, .NET 3.5, .NET 4.0, .NET 4.5, C#, C# 1.0, C# 2.0, C# 3.0, C# 4.0, C# 5.0, Debugging, Development, Software Development | Leave a Comment »