


Interesting: [WayBack] DBA Blog 2.0: Installing Zabbix into Azure using a MySQL PaaS
–jeroen
Posted by jpluimers on 2019/01/04
Interesting: [WayBack] DBA Blog 2.0: Installing Zabbix into Azure using a MySQL PaaS
–jeroen

Posted in *nix, Azure Cloud, Cloud, Cloud Development, Development, Infrastructure, Monitoring, Power User, Software Development, Windows Azure, Zabbix | Leave a Comment »
Posted by jpluimers on 2018/12/31
I’m monitoring quite a bunch of Windows machines with Zabbix.
One of the services I turn off for monitoring is ShellHWDetection as otherwise you get this notification often:
Service "ShellHWDetection" (Shell Hardware Detection) is not running (startup type automatic)
When it happens, it’s always when there is nobody logged on to the machine. But sometimes you do not get this message. I’ve not fully figured out the pattern well, but since the service is associated with auto-play of inserted CD/DVD/USB and other media, I don’t bother too much.
References:
–jeroen
Posted in *nix, Monitoring, Power User, Windows, Zabbix | Leave a Comment »
Posted by jpluimers on 2018/12/13
For my link archive:
Non-stable repos:
–jeroen
Posted in *nix, Linux, Monitoring, Nagios, openSuSE, Power User, SuSE Linux, Tumbleweed | Leave a Comment »
Posted by jpluimers on 2018/12/04
[WayBack] Uptime Robot on Twitter: “Sorry all that the API and status pages fluctuated since the last 18 hours. The issue is completely fixed and it is all back to normal now.”
[WayBack] Jeroen Pluimerson Twitter: “Some are still broken, especially the ones with IDs 778601760 778601763 778601765 778601777 778601814 779973649 779677530 779677532 All of them reachable through various ISPs, but UpTimeRobot marks them down since about 11 hours”
See:
Failing:
Found out what happened: the IP got blocked on some spam lists. This is odd:
Even though the SMTP server behind it has relay blocked apart from the 2 domains it is primary MX for, somebody found a trick around it, I think by sending mail to the primary domains that
The trick caused the IP to appear on 3 blacklists according to MXTOOLBOX:
Blacklist Reason TTL ResponseTime LISTED
CBL 80.100.143.119 was listed Detail 806 0 Ignore Hostkarma Black 80.100.143.119 was listed Detail 805 0 Ignore Spamhaus ZEN 80.100.143.119 was listed Detail 300 281 Ignore
Checking these revealed all to be around CBL:
This IP address was detected and listed 6 times in the past 28 days, and 0 times in the past 24 hours. The most recent detection was at Tue Dec 4 02:25:00 2018 UTC +/- 5 minutes
Your reverse DNS is correct! – snip.xs4all.nl
The IP address for the reverse lookup name matches the original IP – RDNS InformationThis is a list from our log files showing the activity from IP address 80.100.143.119. Our system stores information for 4 days.
/ip-log/karma.log.06:black 80.100.143.119 auth-bad ID=79648-15207 X=mxbackup H=snip.xs4all.nl [80.100.143.119]:40353 HELO=[[127.0.0.1]] SN=[M.ASMMSS.06446644586518723606@terrain.gov.harvard.edu] AUTH=[antonio] T=[irena.getheridge2018@outlook.fr] S=[Re: RcPT[(ALERT) | 0644664458]]
80.100.143.119 is not listed in the SBL
80.100.143.119 is not listed in the PBL
80.100.143.119 is listed in the XBL, because it appears in:
Further research also found an entry in dnsbl.spfbl.net:
Check result of IP 80.100.143.119
This is the rDNS found:
- <snip.xs4all.nl> valid FCrDNS.
This IP was flagged due to misconfiguration of the e-mail service or the suspicion that there is no MTA at it.
For the delist key can be sent, select the e-mail address responsible for this IP:
- add a PayPal user’s email for 6.00 BRL.
- add a PayPal user’s email for 1.50 USD.
- <abuse@xs4all.nl> qualified.
- <postmaster@snip.xs4all.nl> qualified.
- <postmaster@xs4all.nl> qualified.
A chicken-and-egg situation here: since snip.xs4all.nl is blocked because of the blacklist entry, I cannot request a validation email for the blacklist entry.
But then there was MultiRBL showing that most DNS black lists are aggregators of others.
—jeroen

Posted in *nix, DNS, Internet, Monitoring, Power User, Uptimerobot | Leave a Comment »
Posted by jpluimers on 2018/11/28
In [WayBack] Jeroen Pluimers @jpluimers: Every now and then editing @uptimerobot entries failed. Just “HTTP Error 503.4 – Service Unavailable The FastCGI pool queue is full” 1/2 I found out that UptimeRobot:
There is also a maintenance page at uptimerobot.com/maintenance.php#tvMode [Archive.is] and uptimerobot.com/maintenance.php?c-e [Archive.is]. If you get to those, then retry in ~10 minutes as sometimes it takes that long for an update to be processed.
Sometimes setting up multiple Android devices for the same uptimerobot account can be a bit of a hassle: [WayBack] Uptime Robot on Twitter: “Once logged in to the account from another Andriod device, that device will be added as an alert contact too.… “.
All in all it is still a nice tool (:
–jeroen

Posted in *nix, Development, IIS, Monitoring, PHP, Power User, Scripting, Software Development, Uptimerobot, Web Development | Leave a Comment »
Posted by jpluimers on 2018/11/12
Like any product documentation, Zabbix’ is shattered and terse.
So here is how I ensured a specific user could edit the items of hosts:
- Added new user group named
Administer Configuration Host Itemscontaining userExamplehaving these read-write composing permissions:
- Applicatie ontwikkel test
- Applicatie productie Approve demo VPN
- servers Dbases Kantoor applicaties
- Changed
User typeof user namedExamplefromZabbix UsertoZabbix Adminso access to theConfigurationtab is granted.See 2 Permissions [Zabbix Documentation 3.0] for
User typeexplanation; excerpt:
Zabbix Admin: The user has access to the Monitoring and Configuration menus. The user has no access to any host groups by default. Any permissions to host groups must be explicitly given.
–jeroen
Posted in *nix, Monitoring, Power User, Zabbix | Leave a Comment »
Posted by jpluimers on 2018/09/07
 One of the domains not yet monitored at embarcaderomonitoring.wiert.me, was the
 altd download server for ISOs and installers on http and https level. Ultimately you want https, as most of these are about installers, so you do not want any man-in-the-middle to fiddle with them.
Upitmerobot is not yet smart enough to check validity of TLS certificates on https connections.
Chrome, Firefox, Safari, Internet Explorer, wget, curl and ssllabs however are.
Uptimerobot did not like monitoring the plain http://altd.embarcadero.com/ and https://altd.embarcadero.com/ URLs, because the altd is not browsable, so it tries to hide most of its structure from access. This means they both return an odd response:
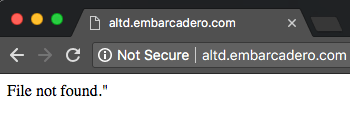
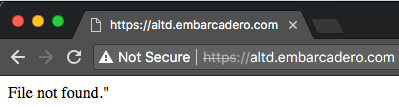
Those responses are actually 404 errors (note the - minus sign after curl --trace-ascii: it sends the trace to stdout):
$ wget http://altd.embarcadero.com/
--2018-09-05 10:44:23-- http://altd.embarcadero.com/
Resolving altd.embarcadero.com (altd.embarcadero.com)... 88.221.144.40, 88.221.144.10
Connecting to altd.embarcadero.com (altd.embarcadero.com)|88.221.144.40|:80... connected.
HTTP request sent, awaiting response... 404 Not Found
2018-09-05 10:44:23 ERROR 404: Not Found.

$ curl --verbose http://altd.embarcadero.com/
*   Trying 88.221.144.40...
* TCP_NODELAY set
* Connected to altd.embarcadero.com (88.221.144.40) port 80 (#0)
> GET / HTTP/1.1
> Host: altd.embarcadero.com
> User-Agent: curl/7.54.0
> Accept: */*
>
< HTTP/1.1 404 Not Found
< Server: Apache
< Content-Type: text/html; charset=iso-8859-1
< Content-Length: 16
< Date: Wed, 05 Sep 2018 08:45:57 GMT
< Connection: keep-alive
<
* Connection #0 to host altd.embarcadero.com left intact
File not found."

$ curl --trace-ascii - http://altd.embarcadero.com/
== Info:   Trying 88.221.144.40...
== Info: TCP_NODELAY set
== Info: Connected to altd.embarcadero.com (88.221.144.40) port 80 (#0)
=> Send header, 84 bytes (0x54)
0000: GET / HTTP/1.1
0010: Host: altd.embarcadero.com
002c: User-Agent: curl/7.54.0
0045: Accept: */*
0052:
<= Recv header, 24 bytes (0x18)
0000: HTTP/1.1 404 Not Found
<= Recv header, 16 bytes (0x10)
0000: Server: Apache
<= Recv header, 45 bytes (0x2d)
0000: Content-Type: text/html; charset=iso-8859-1
<= Recv header, 20 bytes (0x14)
0000: Content-Length: 16
<= Recv header, 37 bytes (0x25)
0000: Date: Wed, 05 Sep 2018 08:47:19 GMT
<= Recv header, 24 bytes (0x18)
0000: Connection: keep-alive
<= Recv header, 2 bytes (0x2)
0000:
<= Recv data, 16 bytes (0x10)
0000: File not found."
File not found."== Info: Connection #0 to host altd.embarcadero.com left intact
This is also the reason that WayBack does not want to archive that link, but it can be archived at [Archive.is] https://altd.embarcadero.com/.
Luckily, a Google search for site:altd.embarcadero.com revealed there is a non-installer file short enough (~72 kibibytes) for Uptime robot to check, so it now verifies it can access these:
–jeroen

Posted in *nix, *nix-tools, cURL, Encryption, HTTPS/TLS security, Monitoring, Power User, Security, Uptimerobot, wget | Leave a Comment »
Posted by jpluimers on 2018/06/18
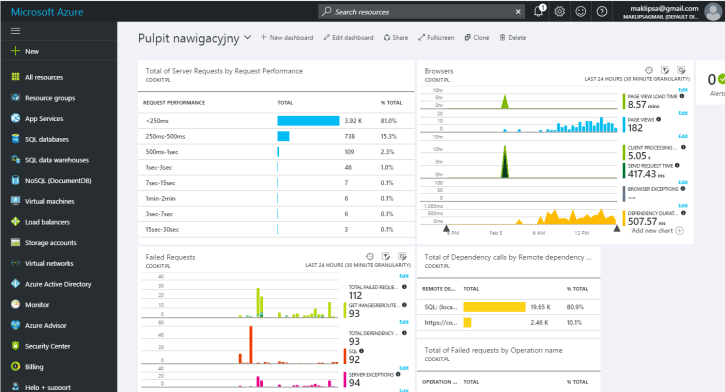
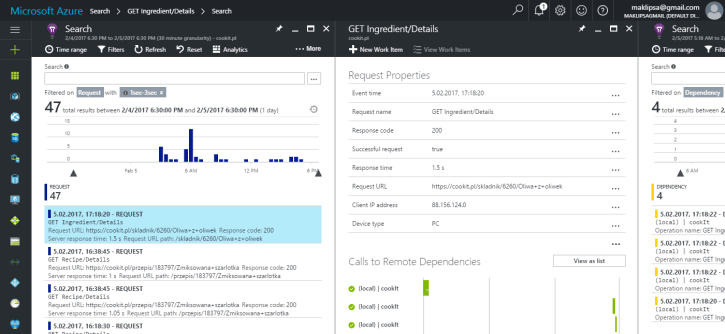
Interesting read:
Searching through logs and remoting to a machine to check it’s load is not a fun thing to do. This is why I’ve decided to look for a centralized logging service. And what I’ve chosen.
It looks like Microsoft App Insight is very much worth trying.
–jeroen

Posted in *nix, Development, Monitoring, Power User | Leave a Comment »
Posted by jpluimers on 2018/04/11
When you use the check on the SMTP port, note that [WayBack] Uptime Robot on Twitter: “Yes, it is not service-specific (yet) but a TCP check.… “.
It does to full DNS protocol checks from IP address though, so I am glad about that.
—jeroen
via: [WayBack] Jeroen Pluimers on Twitter”@uptimerobot I have the impression that the SMTP port check does not really check anything but the port being open. Had a flaky mail server that would react on the TCP level, but timed out on the SMTP level. Uptimerobot did not notice that.”
Posted in *nix, Monitoring, Power User, Uptimerobot | Leave a Comment »
Posted by jpluimers on 2018/03/15
Over time, there are lots of complaints about Embarcadero related internet services (like forums, QC, Appanalytics, docwiki, blogs, web site, maintenance, …) so to track uptime, I’ve created a set of EmbarcaderoMonitoring pages:
This is preliminary work based on my own lists of Embarcadero endpoints combined with some research like [WayBack] dnsdumpster embarcadero.com.png and [WayBack] IdentIPSpy
Underneath, they run on the uptimerobot.com infrastructure which has a limit of 50 free monitors.
It means I have to:
Any ideas on improving this are welcome: please post a comment here on on the resulting G+ thread.
Note it likely won’t show cases like when the website was hacked or TLS certificate issues like in SSLLabs security reports for some embarcadero subdomains. I need to think about a means for those, as it will certainly help monitoring my own infrastructure in a similar way.
–jeroen

Posted in *nix, Cloud, Development, DevOps, Infrastructure, Monitoring, Power User, Software Development, Uptimerobot | Leave a Comment »
