Archive for the ‘Monitoring’ Category
Posted by jpluimers on 2026/02/06
Historically I have been using Uptime Robot a lot, but in practice they are only good for HTTP/HTTPS uptime checking and TCP connection checking. SMTP checking requires more than just a valid TCP check which they can’t, so I took a look at hetrixtools.com.
They advertise being forever free when using a limit number of Uptime/Blacklist endpoints as per
[Wayback/Archive] Free Uptime Monitor & Blacklist Monitor- HetrixTools
- 15 Uptime Monitors • 1 Minute Interval
- 32 Blacklist Monitors • Checked Everyday
FREE Forever!
Unlike many other free uptime checking tools, their interval is better.
A thing to consider is that, like many online-first companies, they do not provide company details on either of these pages which you have to agree with when signing on for their service:
Read the rest of this entry »
Posted in *nix, hetrixtools, Monitoring, PagerDuty, Power User, Uptimerobot | Leave a Comment »
Posted by jpluimers on 2025/11/05
As promised yesterday¹ because “what’s an open source project without its status page” (and some commercial vendors cough Embarcadero cough could highly benefit from this):
[Wayback/Archive] GitHub – louislam/uptime-kuma: A fancy self-hosted monitoring tool.
Some links (so you can try it for yourself):
--jeroen
¹ GitHub – cryptpad/cryptpad: Collaborative office suite, end-to-end encrypted and open-source.
Posted in *nix, *nix-tools, Development, JavaScript/ECMAScript, Monitoring, Power User, Scripting, Software Development, TypeScript, Vue.js | Leave a Comment »
Posted by jpluimers on 2025/11/04
Posted in *nix, *nix-tools, Cloud, CSS, Development, Google, GoogleDocs, HTML, HTML5, Infrastructure, JavaScript/ECMAScript, Monitoring, Power User, Scripting, Software Development, TypeScript, Web Development | Leave a Comment »
Posted by jpluimers on 2025/05/14
I wonder how long this can be hosted on GitHub. Will start using it, just to learn more about the GitHub computing infrastructure.
Links:
--jeroen
Posted in Cloud, Development, DVCS - Distributed Version Control, GitHub, Hosting, Infrastructure, Monitoring, Power User, Software Development, Web Development | Leave a Comment »
Posted by jpluimers on 2024/12/06
Reminder to show how well my experimentation with [Wayback/Archive] Better Uptime went and how they compare to [Wayback/Archive] UptimeRobot.
For now I am at this plan in [Wayback/Archive] Pricing | Better Uptime:
Free:
- e-mail alerts
- 3-minute checks
- 10 monitors
This suffices to keep an eye on the modest IT infrastructure at both our home and the one from my mentally retarded brother.
Note that other prices on that pages are per month. Despite the default selection being “annual plan” the very light grey and thin “/mo” on a black ground indicates they are still per month, but you get 20% discount with the annual plans).
Read the rest of this entry »
Posted in *nix, Amazon SES, Amazon.com/.de/.fr/.uk/..., BetterUptime, Cloud, Infrastructure, Monitoring, Power User, Uptimerobot | Leave a Comment »
Posted by jpluimers on 2024/03/25
Voor als iDEAL het niet lijkt te doen kun je meestal de status hier opvragen: [Wayback/Archive] iDEAL Beschikbaarheid Dashboard.
–jeroen
Posted in *nix, LifeHacker, Linux, Monitoring, Power User | Leave a Comment »
Posted by jpluimers on 2024/03/12
Still working on handling open Chrome tabs after having moved in the period that GitLab had quite a few issues causing my PagerDuty alerts to go wild.
Today PagerDuty gave me 7 calls in 4 hours again (see [Wayback/Archive] Jeroen Wiert Pluimers @wiert@mastodon.social on X: “@gitlab Since 20240312T1727Z I get PagerDuty alerts from HetrixTools for some pages hosted on GitLab. It would be nice if someone could have a look at gitlab.com/gitlab-com/gl-infra/production/-/issues/17717“).
In adddition I need to check if anything made it to the GitLab issue list from the 20230827 connectivity issues I mentioned at [Wayback/Archive] Jeroen Wiert Pluimers @wiert@mastodon.social on X: “Is it @gitlab hosting having transcontinental issues, or are other continental connections affected as well? These are from two different *.gitlab.io pages as measured via @HetrixTools . No issues are listed at status.gitlab.com“.
Back then, this was the most important one: [Wayback/Archive] GitLab System Status: GitLab.com availability issues – October 30, 2023 15:39 UTC
Likely because of this, wiert.me.gitlab.io had been down for a while as well on 20231031 (see [Wayback/Archive] wiert.me.gitlab.io (Recent History) – HetrixTools down from 2023-10-30T15:24Z until 2023-10-30T16:14Z for 3 + 3 + 11 + 27 = 44 minutes.)
Back then, the hardest part was to quickly find out if there was indeed an issue being investigated at all.
The GitLab status multi-media account on Twitter just points to the status page, which makes it hard to find the underlying issue.
I didn’t archive that one in time, but when I got the alerts it didn’t show anything and when it was resolved it was already beyond the cut-off timestamp to mark it as “same day” and the graph didn’t show much down-time [Wayback/Archive] GitLab System Status graph didn’t show much down-time:
Read the rest of this entry »
Posted in *nix, Cloud, Development, DVCS - Distributed Version Control, GitLab, hetrixtools, Infrastructure, Monitoring, PagerDuty, Power User, Software Development, Source Code Management | Leave a Comment »
Posted by jpluimers on 2022/03/08
The [Wayback/Archive] Embarcadero/IDERA Documentation Wiki has been mostly down since March 3rd, 2022 (not the main page, but almost all other pages are).
I modified [Wayback/Archive] Docwiki https – EmbarcaderoMonitoring to show the actual status of a deeper page as the (mostly static) top page is up, so monitoring that is useless as the deeper pages are down.
The deeper pages are dynamic and require a functioning MySQL database connection. That connection is mostly down (the error message is not clear, so this could be a network or a database server problem, or maybe even a loadbalancer gradually entering bit heaven).
Since it had been down for like 6 days in February*, I’d expect Idera to keep an eye on it and prepare for more downtime. Apparently that’s either not a 24×7 thing for them or they missed the “pre” in preparation as it is dead-silent on .
It also runs on an unsupported version of Mediawiki 1.31** which by itself does not explain the outage, but does indicate that their idea of handling their internal lifetime management is different than what they advocate to clients in their software subscription model, see [Wayback/Archive] Delphi – Embarcadero store, [Wayback/Archive] Update Subscription – Embarcadero and [Wayback/Archive] Special Offers on RAD Studio, Delphi & C++Builder – Embarcadero:
Read the rest of this entry »
Posted in *nix, Bookmarklet, Delphi, Development, JavaScript/ECMAScript, Lightweight markup language, MediaWiki, Monitoring, Power User, Scripting, SocialMedia, Software Development, Twitter, Uptimerobot, Web Browsers | Leave a Comment »
Posted by jpluimers on 2022/01/19
Since uptimerobot has slowly moving free features, part of my family uses it to monitor uptime of their personal stuff, and I don’t want to pay for the free monitoring I do on Embarcadero infrastructure (I know that they have been phasing out older useful sites for ages, but even their main sites were down for 2 days about a year ago).
Yes, I know the competitiveness of [Wayback] Website monitoring – Wikipedia, and I’m glad Uptimerobot has been there for a relatively long time, but alas: for personal use…
The list of of the pricing pages of each site, containing a one line summary blurb if it was available:
- [Wayback] Freshping – Pricing
Freshping FREE plan ✓ 50 URL checks ✓ 1-minute interval ✓ FREE Public status pages. Need more? Check out the enterprise plan.
- [Wayback] Pricing | Checkly
50k API check runs / mo, 5k browser check runs / mo, 5 users, basic features
- [Wayback] StatusCake – Try it Today!
Basic, FREE, 10 Uptime Monitors, 5 Minute Tests
- [Wayback] pricing | Happy Apps
Free: 3 Checks, 5 minute min. monitoring interval, All check types, 3 days history max, 0 sms alerts, ∞ email alerts, SSH Only
Via [Wayback] 16 Best Online Services to Monitor Sites Uptime
–jeroen
Posted in *nix, Delphi, Development, Monitoring, Power User, Software Development | Leave a Comment »
Posted by jpluimers on 2021/01/01
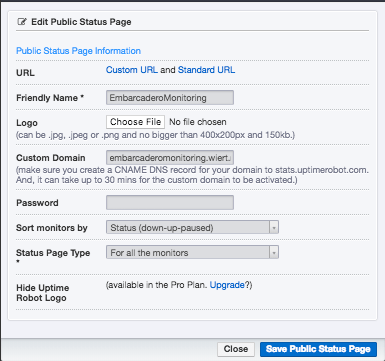
 Below a few screenshots on how to bind your own subdomain to a set of uptimerobot monitors.
This case is about [Archive.is] embarcaderomonitoring.wiert.me, which I setup because of the not so well way that Embarcadero maintained their web facing infrastructure in the past.
The steps for that are really simple, assuming you already have an uptimerobot account and some monitor set-up. If you don’t: check out the first video (thanks onewebstreet!) linked below the fold, as it is a step-by-step introduction.
Steps for your own subdomain
If you like video more than a list of steps, check out the second video (thanks Kyle!) below the fold.
- Ensure you have a DNS CNAME record that points your subdomain (in my case
embarcaderomonitoring.wiert.me) to stats.uptimerobot.com:

Note that [Archive.is] stats.uptimerobot.com by itself will not display any dashboard, as it requires a CNAME to be involved that is registered in the Uptime robot Custom Domain list.
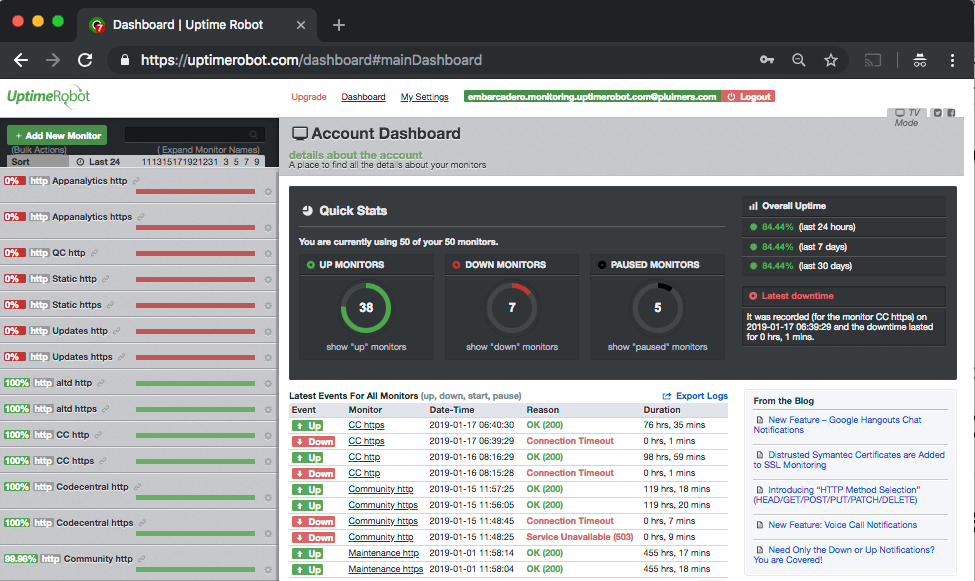
- Login to Uptime robot, which brings you to uptimerobot.com/dashboard#mainDashboard
- Click on settings, which brings you to uptimerobot.com/dashboard#mySettings
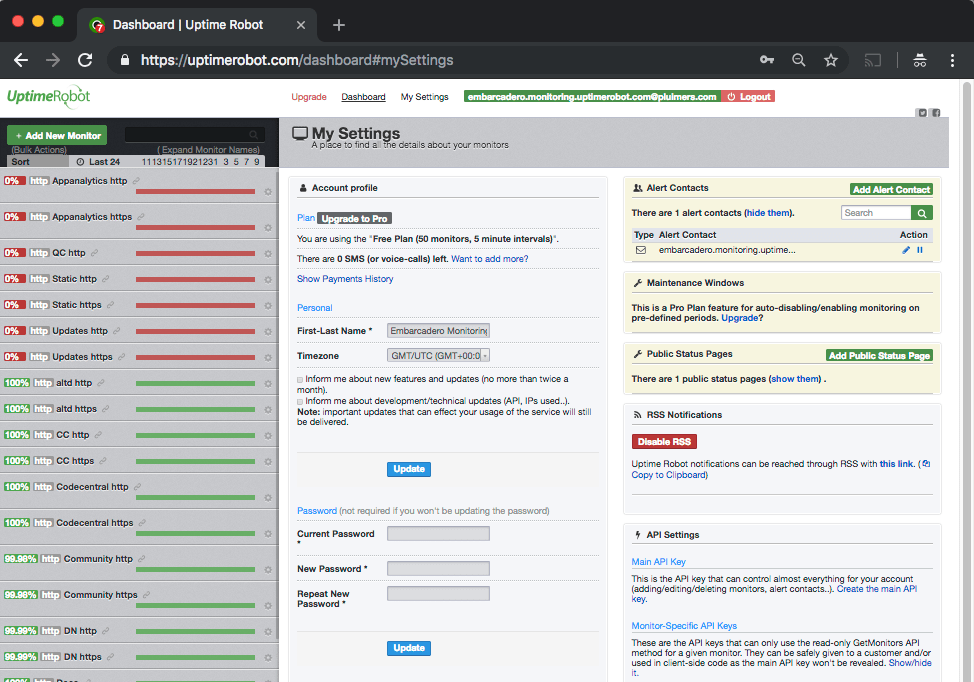
- Observe the “Disable RSS” (or “Enable RSS” if you have not yet enabled it) and the “this link” (which in my case points to this RSS feed [WayBack])
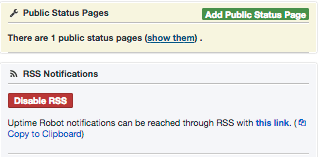
- Clicking on “show them” will get you something like this:
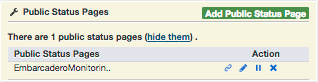
- Clicking on the pencil icon then will get you where you can set the “Custom Domain”, which notes
Custom Domain
(make sure you create a CNAME DNS record for your domain to stats.uptimerobot.com. And, it can take up to 30 mins for the custom domain to be activated.)
- Wait a while and check your CNAME for a valid Uptime robot status dashboard.
–jeroen
Read the rest of this entry »
Posted in *nix, LifeHacker, Monitoring, Power User, Uptimerobot | Leave a Comment »


