The Wiert Corner – irregular stream of stuff

Jeroen W. Pluimers on .NET, C#, Delphi, databases, and personal interests

  • My badges

  • Twitter Updates

  • My Flickr Stream

  • Pages

  • All categories

  • Enter your email address to subscribe to this blog and receive notifications of new posts by email.

    Join 1,839 other subscribers

Archive for the ‘.NET’ Category

Chromium Embedded Framework – some links

Posted by jpluimers on 2021/07/13

For my link archive:

–jeroen

Read the rest of this entry »

Posted in .NET, Delphi, Development, Software Development | Leave a Comment »

SetProcessWorkingSetSize: you hardly – if ever – need to call this from your process

Posted by jpluimers on 2021/07/07

There are quite a few posts that recommend using SetProcessWorkingSetSize to trim your process working set, usually in the SetProcessWorkingSetSize(ProcessHandle, -1, -1) form:

[WayBack] SetProcessWorkingSetSize function (winbase.h) | Microsoft Docs

Sets the minimum and maximum working set sizes for the specified process.

BOOL SetProcessWorkingSetSize(
  HANDLE hProcess,
  SIZE_T dwMinimumWorkingSetSize,
  SIZE_T dwMaximumWorkingSetSize );

The working set of the specified process can be emptied by specifying the value (SIZE_T)–1 for both the minimum and maximum working set sizes. This removes as many pages as possible from the working set. The [WayBack] EmptyWorkingSet function can also be used for this purpose.

In practice you hardly ever have to do this, mainly because this will write – regardless of (dis)usage – all of your memory to the pagefile, even the memory your frequently use.

Windows has way better heuristics to do that automatically for you, skipping pages you frequently use.

It basically makes sense in a few use cases, for instance when you know that most (like 90% or more) of that memory is never going to be used again.

Another use case (with specific memory sizes) is when you know that your program is going to use a defined range of memory, which is outside what Windows will heuristically expect from it.

A few more links that go into more details on this:

  • [WayBack] windows – Pros and Cons of using SetProcessWorkingSetSize – Stack Overflow answers by:
    • Hans Passant:

      SetProcessWorkingSetSize() controls the amount of RAM that your process uses, it doesn’t otherwise have any affect on the virtual memory size of your process. Windows is already quite good at dynamically controlling this, swapping memory pages out on demand when another process needs RAM.

      By doing this manually, you slow down your program a lot, causing a lot of page faults when Windows is forced to swap the memory pages back in.

      SetProcessWorkingSetSize is typically used to increase the amount of RAM allocated for a process. Or to force a trim when the app knows that it is going to be idle for a long time. Also done automatically by old Windows versions when you minimize the main window of the app.

    • Zack Yezek:

      The only good use case I’ve seen for this call is when you KNOW your process is going to hog a lot of the system’s RAM and you want to reserve it for the duration. You use it to tell the OS “Yes, I’m going to eat a lot of the system RAM during my entire run and don’t get in my way”.

    • Maxim Masiutin:

      We have found out that, for a GUI application written in Delphi for Win32/Win64 or written in a similar way that uses large and heavy libraries on top of the Win32 API (GDI, etc), it is worth calling SetProcessWorkingSetSize once.

      We call it with -1, -1 parameters, within a fraction of second after the application has fully opened and showed the main window to the user. In this case, the SetProcessWorkingSetSize(... -1, -1) releases lots of startup code that seem to not needed any more.

  • [WayBack] c# – How to set MinWorkingSet and MaxWorkingSet in a 64-bit .NET process? – Stack Overflow answer by Hans Passant:

    Don’t pinvoke this, just use the Process.CurrentProcess.MinWorkingSet property directly.

    Very high odds that this won’t make any difference. Soft paging faults are entirely normal and resolved very quickly if the machine has enough RAM. Takes ~0.7 microseconds on my laptop. You can’t avoid them, it is the behavior of a demand_paged virtual memory operating system like Windows. Very cheap, as long as there is a free page readily available.

    But if it “blips” you program performance then you need to consider the likelihood that it isn’t readily available and triggered a hard page fault in another process. The paging fault does get expensive if the RAM page must be stolen from another process, its content has to be stored in the paging file and has to be reset back to zero first. That can add up quickly, hundreds of microseconds isn’t unusual.

    The basic law of “there is no free lunch”, you need to run less processes or buy more RAM. With the latter option the sane choice, 8 gigabytes sets you back about 75 bucks today. Complete steal.

  • [WayBack] c++ – SetProcessWorkingSetSize usage – Stack Overflow answer by MSalters:

    I had an application which by default would close down entirely but keep listening for certain events. However, most of my code at that point would not be needed for a long time. To reduce the impact my process made, I called SetProcessWorkingSetSize(-1,-1);. This meant Windows could take back the physical RAM and give it to other apps. I’d get my RAM back when events did arrive.

    That’s of course unrelated to your situation, and I don’t think you’d benefit.

  • [WayBack] delphi – When to call SetProcessWorkingSetSize? (Convincing the memory manager to release the memory) – Stack Overflow

    If your goal is for your application to use less memory you should look elsewhere. Look for leaks, look for heap fragmentations look for optimisations and if you think FastMM is keeping you from doing so you should try to find facts to support it. If your goal is to keep your workinset size small you could try to keep your memory access local. Maybe FastMM or another memory manager could help you with it, but it is a very different problem compared to using to much memory.

    you can check the FasttMM memory usage via FasttMM calls GetMemoryManagerState and GetMemoryManagerUsageSummary before and after calling API SetProcessWorkingSetSize.

    I don’t need to use SetProcessWorkingSetSize. FastMM will eventually release the RAM.


    To confirm that this behavior is generated by FastMM (as suggested by Barry Kelly) I crated a second program that allocated A LOT of RAM. As soon as Windows ran out of RAM, my program memory utilization returned to its original value.

  • [WayBack] delphi – SetProcessWorkingSetSize – What’s the catch? – Stack Overflow answer by Rob Kennedy:

    Yes, it’s a bad thing. You’re telling the OS that you know more about memory management than it does, which probably isn’t true. You’re telling to to page all your inactive memory to disk. It obeys. The moment you touch any of that memory again, the OS has to page it back into RAM. You’re forcing disk I/O that you don’t actually know you need.

    If the OS needs more free RAM, it can figure out which memory hasn’t been used lately and page it out. That might be from your program, or it might be from some other program. But if the OS doesn’t need more free RAM, then you’ve just forced a bunch of disk I/O that nobody asked for.

    If you have memory that you know you don’t need anymore, free it. Don’t just page it to disk. If you have memory that the OS thinks you don’t need, it will page it for you automatically as the need arises.

    Also, it’s usually unwise to call Application.ProcessMessages unless you know there are messages that your main thread needs to process that it wouldn’t otherwise process by itself. The application automatically processes messages when there’s nothing else to do, so if you have nothing to do, just let the application run itself.

–jeroen

Posted in .NET, C, C++, Delphi, Development, Software Development, Windows Development | Leave a Comment »

DCOM calls from thread pool threads: CoInitialize/CoUnitialize location and expensiveness?

Posted by jpluimers on 2021/06/24

Interesting takeaway from [WayBack] DCOM calls from thread pool threads

call CoInitialize* at the start, and call CoUninitialize before returning. Expensive, but necessary

Related:

–jeroen

Posted in .NET, C, C++, COM/DCOM/COM+, Delphi, Development, Software Development, Windows Development | Leave a Comment »

“No mapping for the Unicode character exists in the target multi-byte code page”

Posted by jpluimers on 2021/06/24

Usually when I see this error [Wayback] “No mapping for the Unicode character exists in the target multi-byte code page” – Google Search, it is in legacy code that uses string buffers where decoding or decompressing data into.

This is almost always wrong no matter what kind of data you use, as it will depend in your string encoding.

I have seen it happen especially in these cases:

  • base64 decoding from string to string (solution: decode from a string stream into a binary stream, then post-process from there)
  • zip or zlib decompress from binary stream to string stream, then reading the string stream (solution: decompress from binary stream to binary stream, then post-process from there)

Most cases I encountered were in Delphi and C code, but surprisingly I also bumped into C# exhibiting this behaviour.

I’m not alone, just see these examples from the above Google search:

–jeroen

Posted in .NET, base64, C, C#, C++, Delphi, Development, Encoding, Software Development, Unicode | Leave a Comment »

Getting the path of an XML node in your code editor

Posted by jpluimers on 2021/05/27

A few links for my link archive, as I often edit XML files (usually with different extensions than .xml, because historic choices that software development vendors make, which makes it way harder to tell editors “yes, this too is XML).

–jeroen

Read the rest of this entry »

Posted in .NET, Development, Notepad++, Power User, Software Development, Text Editors, Visual Studio and tools, vscode Visual Studio Code, XML, XML/XSD | Leave a Comment »

msbuild build events can inherit, but not add in addition to inherited build events (so projects in Visual Studio, Delphi and others cannot do that either)

Posted by jpluimers on 2021/05/26

Bummer: I tried to inherit the build events from a base configuration, then add some extra steps for some of the inheriting configurations.

Those configurations just executed the extra steps, not the inherited steps.

This affects Visual Studio, Delphi and any other tool based on msbuild, as this is an ms-build thing:

–jeroen

Posted in .NET, Continuous Integration, Delphi, Development, msbuild, Software Development, Visual Studio and tools | Leave a Comment »

SQL Server: RowVersion is not the same format as BigInt

Posted by jpluimers on 2021/05/18

A while ago, I needed to get RowVersion binary data out of SQL Server. People around me told me it is stored as BigInt.

I luckily bumped into [WayBack] sql server – Cast rowversion to bigint – Stack Overflow.

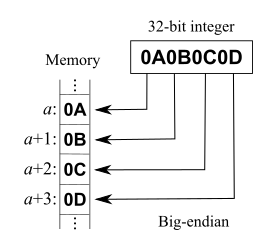
That post explains RowVersion is not stored as BigInt. Both RowVersion and BigInt take up 8 bytes of storage, but RowVersion is big-endian and unsigned, whereas BigInt is little-endian and signed.

A few quotes from it:

In my C# program I don’t want to work with byte array, therefore I cast rowversion data type to bigint:

SELECT CAST([version] AS BIGINT) FROM [dbo].[mytable]

So I receive a number instead of byte array. Is this conversion always successful and are there any possible problems with it? If so, in which data type should I cast rowversion instead?

and

You can convert in C# also, but if you want to compare them you should be aware that rowversion is apparently stored big-endian, so you need to do something like:

byte[] timestampByteArray = ... // from datareader/linq2sql etc...
var timestampInt = BitConverter.ToInt64(timestampByteArray, 0);
timestampInt = IPAddress.NetworkToHostOrder(timestampInt);

It’d probably be more correct to convert it as ToUInt64, but then you’d have to write your own endian conversion as there’s no overload on NetworkToHostOrder that takes uint64. Or just borrow one from Jon Skeet (search page for ‘endian’).

Code: [WayBack] Jon Skeet: Miscellaneous Utility Library

Related:

--jeroen

Posted in .NET, Database Development, Delphi, Development, Jon Skeet, Software Development, SQL Server | Leave a Comment »

Preference variable $ConfirmPreference allows getting more or less PowerShell confirmation prompts

Posted by jpluimers on 2021/05/04

On my list to experiment with are [Wayback] about_Preference_Variables – PowerShell | Microsoft Docs, especially

$ConfirmPreference

Determines whether PowerShell automatically prompts you for confirmation before running a cmdlet or function.

The $ConfirmPreference variable’s valid values are HighMedium, or Low. Cmdlets and functions are assigned a risk of HighMedium, or Low. When the value of the $ConfirmPreference variable is less than or equal to the risk assigned to a cmdlet or function, PowerShell automatically prompts you for confirmation before running the cmdlet or function.

If the value of the $ConfirmPreference variable is None, PowerShell never automatically prompts you before running a cmdlet or function.

To change the confirming behavior for all cmdlets and functions in the session, change $ConfirmPreference variable’s value.

To override the $ConfirmPreference for a single command, use a cmdlet’s or function’s Confirm parameter. To request confirmation, use -Confirm. To suppress confirmation, use -Confirm:$false.

Valid values of $ConfirmPreference:

  • None: PowerShell doesn’t prompt automatically. To request confirmation of a particular command, use the Confirm parameter of the cmdlet or function.
  • Low: PowerShell prompts for confirmation before running cmdlets or functions with a low, medium, or high risk.
  • Medium: PowerShell prompts for confirmation before running cmdlets or functions with a medium, or high risk.
  • High: PowerShell prompts for confirmation before running cmdlets or functions with a high risk.

–jeroen

Posted in .NET, CommandLine, Development, PowerShell, PowerShell, Scripting, Software Development | Leave a Comment »

Windows DLL and EXE rebase

Posted by jpluimers on 2021/04/20

Some links on rebase for Windows DLLs and EXE files, including effects on .NET CLR.

–jeroen

Posted in .NET, Delphi, Development, Software Development, Windows Development | Leave a Comment »

Advanced .NET DebuggingCLR Inside Out – Improving Application Startup Time | Advanced .NET Debugging

Posted by jpluimers on 2021/04/13

The original html source of [WayBack] Advanced .NET DebuggingCLR Inside Out – Improving Application Startup Time | Advanced .NET Debugging is hard to find as it is not in the WayBack machine.

Many places link to it, for instance [WayBack] c# – NGen and Gacutil best practices – Stack Overflow and [WayBack] Improving .NET 2.0 Application Performance – Sean McBreen’s WebLog.

From the .chm file [WayBack] download.microsoft.com/download/…/MSDNMagazineFebruary2006en-us.chm via [WayBack] MSDN Magazine Issues copied using [WayBack] ‎CHM Reader on the Mac App Store:

CLR INSIDE OUT
Improving Application Startup Time
Claudio Caldato


Contents


Visual Studio is a wonderful development environment, whose IntelliSense®, integrated debugging, online help, and code snippets help boost your performance as a developer. But just because you’re writing code fast doesn’t mean you’re writing fast code.

Over the few past months, the CLR performance team met with several customers to investigate performance issues in some of their applications. One recurring problem was client application startup time. So in this column, I’ll present lessons we learned analyzing these applications.

Planning for Performance

Your success in reaching your performance goals depends on the process you will be using. A good process can help you achieve the level of performance you need. These four simple rules will help:

Think in Terms of Scenarios  Scenarios can help you focus on what is really important. For instance, if you are designing a component that will be used at startup, it is likely that the component will be called only once (when the app starts). From a performance point of view you want to minimize the use of external resources, such as network or disk, because they are likely to be a bottleneck. If you don’t take into account that the component will be used at startup, you could spend time optimizing code paths without seeing any significant improvement. The reason is that most of the startup time will be spent loading DLLs or reading configuration files.

For startup scenarios you should analyze how many modules are loaded and how your app is going to access configuration data (files on disk, the registry, and so on). Refactoring your code by removing some dependencies or by delay-loading modules (which I’ll cover later) could result in big performance improvements.

For code that is called repeatedly (such as a hash or parse function), speed is key. To optimize, you need to focus on the algorithms and minimize the cost per instruction. Data locality is also important. For example, if the algorithm touches large regions of memory, it is likely that L2 cache misses will prevent your algorithm from running at the fastest speed. Two metrics that you can use in this scenario are CPU cost per iteration and allocations per iteration. Ideally you want them both to be low. These examples should illustrate that performance is very context-dependent, and playing out scenarios can help you to tease out important variables.

Next time, before you start writing code, spend some time thinking about the scenarios in which the code will run, and identify which are the metrics and what are the factors that will impact performance. If you apply these simple recommendations, your code will perform well by design.

Set Goals  It’s a trivial concept, but sometimes people forget that, in order to decide if an application is fast or slow, you need to have goals to measure against. All performance goals you define (for instance, that the main window of your application should be fully painted within three seconds of application launch) should be based on what you think is the customer expectation. Sometimes it is not easy to think in terms of hard numbers early in the product development cycle (when you are supposed to set your performance goals), but it is better to set a goal and revise it later than not to have a goal at all.

Make Performance Tuning Iterative  The process should consist of measuring, investigating, refining/correcting. From the beginning to the end of the product cycle, you need to measure your app’s performance in a reliable, stable environment. You should avoid variability that’s due to external factors (for instance, you should disable anti-virus or any automatic update such as SMS, so they don’t interfere with performance test execution). Once you have measured your application’s performance, you need to identify the changes that will result in the biggest improvements. Then change the code and start the cycle again.

Know Your Platform Well  Before you start writing code, you should know the cost of each feature you will use. You need to know, for instance, that reflection is generally expensive so you’ll need to be careful using it. (This doesn’t mean that reflection should be avoided, just that it has specific performance requirements.)

Now let’s move past the planning stage and tackle some coding problems. Startup time can be a problem for client applications with complex UI and connections to multiple data sources. End users expect the main window to appear as soon as they double-click on the app’s icon, so startup time has a big impact on how customers view your application. Knowing the two types of startup scenarios you will be dealing with, cold and warm startup, will help you focus your efforts.

An example of cold startup is when your application starts for the first time after a reboot. Another could be if you start an application, close it, and then launch it again after a long period of time. Cold startup is dominated by hard faults. When an application starts up, if the pages required (code, static data, registry, and so forth) are not present in the OS memory manager’s standby list, disk access is needed to bring those pages into memory. These page requests or page faults are known as hard faults.

In the warm startup scenario (for instance, you have already run a managed application once), it is likely that most of the pages for the main common language runtime (CLR) components are already loaded in memory from where the OS can reuse them, saving expensive disk access time. This is why a managed application is much faster to start up the second time you run it. These soft faults dominate warm startup.

Now that you know what cold and warm startup are, let’s see how you can improve them. The following sections address concrete measures you can take.

Load Fewer Modules at Startup

Cold startup can benefit from loading fewer modules (as you can imagine, the result is less disk access). Even warm startup benefits from loading fewer modules because the associated CPU overhead is avoided. To figure out which modules your application loads, you can use VAdump. VAdump is included in the Platform SDK. If you type vadump –sop <process#> you will see something like Figure 1.

There are some CLR modules that must be loaded every time but you may have some flexibility with others. In the previous example, if you are not using XML and you see System.Xml.ni.dll in the list of modules loaded, it means there is a module in your application that references System.Xml.dll. You can check the code and verify that the reference is actually necessary. If you remove the unnecessary reference, you can improve the startup profile and working set of your app.

To reduce the number of loaded modules you can also avoid code paths that require additional modules. Very often, minor code refactoring can help avoid loading additional DLLs. For example consider the following code:

void Start() {
    try {
        LaunchApplication();
    } catch (Exception e) {
        TypeInAnotherAssembly.DisplayMessageBox("error");
    }    
}

When the CLR just-in-time (JIT) compiles the Start method it needs to load all assemblies referenced within that method. This means that all assemblies referenced in the exception handler will be loaded, even though they might not be needed most of the time the application is executed. In such cases, the code in the exception handler can be moved to a separate method, say ProcessException(Exception). Assuming ProcessException is large enough that it will not get inlined (otherwise the Microsoft® intermediate language, or MSIL code, would be very similar to the code generated for the previous example), the type from the other assembly is not referenced in the Start method, so the CLR JIT will not need to load it (if it is small enough to be inlined, you can use a MethodImplAttribute on the method to prevent inlining). It will be loaded only when the code throws the exception and ProcessException needs to be compiled. Of course, this is only a simple example; other times you might need to make more significant changes in order to achieve the same result.

Another way to reduce the number of modules loaded is by merging multiple modules into one. Clearly this applies only if you have control over them. In terms of the CPU, assembly loads have fusion binding and CLR assembly-loading overhead in addition to the LoadLibrary call, so fewer modules mean less CPU time. In terms of memory usage, fewer assemblies also mean that the CLR will have less state to maintain.

Avoid Unnecessary Initialization

It may seem obvious, but avoiding unnecessary initialization can also improve startup time, and it’s easy to get this wrong. In the Microsoft .NET Framework, any initialization that needs to happen for a class is performed in the class constructor. If that code references other classes, it can cause a cascading effect where a large number of class constructors are executed. Figure 2 shows a simple example.

The DatatType class initializes two fields, among others. This triggers the class constructors of the referenced classes. One instance is of the StringFacetChecker class, which creates an instance of the Regex class in its constructor. Even if the Regex instance is rarely used, you’ll still have to pay the cost of its initialization. By doing the Regex initialization on demand rather than as part of the class constructor, you can reduce the performance cost of the DataType class for most of the applications that will use it.

Place Strong-Named Assemblies in the GAC

If an assembly is not installed in the Global Assembly Cache (GAC), you will pay the cost of hash verification of strong-named assemblies along with native code generation (NGEN) image validation if a native image for that assembly is available in the machine. In other words, if an assembly is strong named, the CLR will ensure the integrity of the assembly binary by verifying that the cryptographic hash of the assembly matches the one in the assembly manifest. But if the assembly is in the GAC, this verification can be skipped because the verification is performed as part of installation into the GAC and any update requires administrative permissions. So the CLR is basically assured that changes have not occurred.

The hash verification process is expensive because it involves touching every page in the assembly, which can be bad for cold startup. Also, the hash computation is CPU-intensive and thus impacts warm startup, too. The extent of the impact depends on the size of the assembly being verified.

If an assembly has been precompiled using NGEN but it is not installed in the GAC, then during binding, fusion needs to verify that the native image and the MSIL assembly are the same version (to avoid cases where a newer version of the assembly is deployed on the machine but a newer version of the native image is not generated). In order to accomplish that, the CLR needs to access pages in the MSIL assembly, which can hurt cold startup time.

As an aside, if you are going to deploy assemblies marked with the AllowPartiallyTrustedCallersAttribute to the GAC, make sure you have carefully reviewed them to ensure they don’t make you vulnerable to any security exploits. Assemblies installed in the GAC can be called by any managed code application, including potential dangerous code downloaded from unsafe sites.

Use NGEN

The JIT compiler compiles methods as they are required during execution. This runtime compilation has several effects on performance. First, JIT compilation consumes CPU cycles. Second, compiled code lives in dynamically allocated heaps which are private to each process. This could have a big impact in scenarios like Terminal Server, where the app scalability can benefit from sharing pages among user sessions. Finally, lots of metadata pages are touched within referenced assemblies, an operation that otherwise might not be required.

CPU consumption during JIT compilation can become a bottleneck in warm startups, and the additional disk accesses incurred can also have a significant impact on cold startup scenarios.

The NGEN tool (installed with the .NET Framework) is used to precompile all methods in an assembly and installs a native image file on the machine so it can be used instead of JIT-compiling the code.

Using NGEN can improve startup because no CPU resources are consumed by the JIT compiler, fewer pages are touched (since the CLR does not need to look up metadata in referenced assemblies), and page sharing across processes is increased because code and data lie in NGEN image pages. (A large number of NGEN image pages are read-only and thus can be shared among processes).

Note the subtle tradeoff here. Using NGEN means trading CPU consumption for more disk access, since the native image generated by NGEN is likely to be larger than the MSIL image. You might be wondering if this could hurt cold startup as it results in increased disk activity. Interestingly, the CLR Performance team has observed that if JIT compilation is completely eliminated, cold startup time typically improves. This is because CLR loads far fewer pages from referenced assemblies as mentioned before, and it does not load mscorjit.dll and the MSIL assembly files.

Anyway, you should always measure cold startup time to determine the impact of NGEN on your scenario and then decide what is the best choice for you. You can get more information about NGEN at Native Image Generator and in the MSDN®Magazine article “NGEN Revs Up Your Performance With Powerful New Features” by Reid Wilkes.

Avoid Rebasing

If you use NGEN, you need to be aware that rebasing could occur when the native images are loaded in memory. If a DLL does not get to load at its preferred base address (because that address range is already allocated to another module or allocation), the OS loader will load it wherever it sees fit. This can be a very expensive operation because the loader has to update all addresses referring to locations within the DLL based on the new address where the DLL is loaded. From a performance point of view, this is bad because the OS loader has to read every page that contains an address, and once a page is written to, it becomes private to that process: the page now needs to be backed by the page file. In addition, cold startup time is impacted because there is a CPU cost associated with updating the DLL addresses, and there is more disk access because more pages must be touched. If you build more than one DLL as part of your application, rebasing will definitively occur when the application is loaded, since the default base address assigned to every DLL is always the same (0x400000).

The quickest way to approximate if one or more modules have been rebased is to use VAdump (vadump –sop <process ID>) and check if there are modules where all the pages are private. If so the module might have been rebased to a different address and thus its pages cannot be shared. You can also use tlist.exe (the Platform SDK command-line equivalent of the task manager) and cross-check if modules are loaded at their preferred address. tlist <process id> will list all modules loaded by the process with the address where they are loaded. You can find out which is the preferred base address by looking at the MSIL image using the Ildasm tool (installed with Visual Studio® 2005 under the SDK directory). If you double-click on the assembly’s manifest you will see, among other information, output like that shown in Figure 3.

The NGEN tool uses the imagebase property in the assembly’s manifest to set the base address for the native image. You can also use Link –dump –headers <native image file> to find out the preferred base address. Native image files can be found under %SystemRoom%\assembly\NativeImages_<.NET Framework version>.

If you detect that one or more modules are rebased, you can fix the problem by recompiling the code, specifying a different base address with the /baseaddress option. In Visual Studio, you can set the base address option from the advanced tab in the project properties by clicking on the Advanced button.

Also, you can use the Rebase tool that ships with the platform SDK, which does not require a recompilation. Native images are usually larger than the corresponding MSIL files, so make sure you take that into account when you set the preferred base addresses to avoid conflict due to the fact that native images are bigger. The Rebase tool does not work for strongly signed assemblies because it would invalidate the signature, and the assembly would not be considered valid.

Application Configuration

Application configuration also affects startup performance. The .NET Framework provides support for retrieving application configuration settings stored in XML format. While this is a convenient feature, you need to be aware of its performance cost. If your application has simple configuration requirements and has strict startup time goals, registry entries or a simple INI file might be a better alternative.

The table in Figure 4 compares two scenarios: using an XML-based config file and a simple text file to read some configuration settings for a simple client application.

As you can see, using config files has an impact on both working set and the number of DLLs that are loaded at startup time. There are, of course, scenarios where XML config files make sense, for instance to save complex settings (debugging/tracing options, configuration for different libraries used in your application, and so on), but they are an unnecessary cost if you have very simple config requirements. For instance, using an XML file to save only the location of the app’s main window is not a wise decision.

The Impact of AppDomains

Often, especially for security reasons, you cannot avoid using multiple AppDomains. However, doing so can limit performance at startup. You can reduce the impact of multiple App Domains if you take into account the following recommendations.

Load Assemblies as Domain Neutral  If an assembly is loaded as domain neutral, it means its code can be reused in another AppDomain. If the assembly is loaded in more than one AppDomain as domain bound (which is the default) each AppDomain gets its own copy of the code. This has several bad performance characteristics. First there’s CPU cost. If there is a native image for the assembly, only the first AppDomain can use the native image. All other AppDomains will have to JIT-compile the code which can result in a significant CPU cost.

Next, the JIT-compiled code resides in private memory, so it cannot be shared with other processes or AppDomains. If the assembly did have an NGEN image, then the first AppDomain uses the image. All the other AppDomains have to JIT-compile the code, which means that the MSIL DLL for that assembly is also loaded. This is the worst possible scenario from a cold startup perspective because disk access for that assembly would double.

Loading the assembly as domain neutral ensures that the native image, if one exists, gets used in all AppDomains created in the application. If a native image does not exist there is still a benefit in loading assemblies as domain neutral because code gets compiled just once and then shared by all AppDomains in the application.

Enforce Efficient Cross-AppDomain Communication  Needless to say, fewer cross-AppDomain calls are better from a performance standpoint. Calls with no arguments or with simple primitive type arguments offer the best performance.

For methods with reference type arguments, the more complex the object graph the poorer the performance is. In the .NET Framework 2.0, most cross-AppDomain calls have been optimized to perform much better than they did in the.NET Framework 1.1. But there are still cases where method calls may not be able to take advantage of the superior performance. Some common examples are calls on interfaces from domain-bound assemblies, calls with “ref” or “out” arguments, calls to AppDomains with shadow-copying of assemblies turned on, and partial trust AppDomains.

Use NeutralResourcesLanguageAttribute  When asked for a resource, the ResourceManager first checks for the existence of satellite assemblies for the current UI culture, then for the parent of the current UI culture, and finally for the neutral culture. If the current UI culture is the neutral culture too, then the CLR can avoid two satellite assembly lookups by directly accessing the neutral culture resources. The NeutralResourcesLanguageAttribute allows a developer to tell the ResourceManager what the neutral culture is. If the ResourceManager finds that the current UI culture is the same as the neutral culture for that assembly, it will access the neutral culture resources directly. This avoids unsuccessful assembly lookups, which tend to be expensive in terms of CPU usage.

Use Serialization Wisely  Using serialization (or deserialization) at startup can have a significant negative impact on performance. These are inherently expensive operations in terms of CPU and memory allocation. Moreover, a lot of code is loaded that would probably not have been needed otherwise.

If you must use serialization, it is better if you use the BinaryFormatter class instead of the XmlSerializer class. BinaryFormatter is implemented in the Base Class Library (BCL), or mscorlib.dll. XmlSerializer is implemented in System.Xml.dll, which might represent an additional DLL to load in some scenarios. BinaryFormatter also tends to be faster than XmlSerializer. But as I said, these are general guidelines that you need to test for your own scenario. The recommended approach is to measure speed and memory consumption of the two serialization approaches and then decide which one performs better in your scenario.

If you must use the XmlSerializer, you can achieve better performance if you pre-generate the serialization assembly, an option new to the .NET Framework 2.0. XmlSerializer works by generating an assembly to perform the serialization. This assembly is either generated on the fly, or can be pre-generated using the sgen tool (sgen ships with the .NET Framework 2.0 SDK). In addition to the actual serialization work, the on-the-fly generation involves the use of the CodeDOM to generate C# code. This means invoking the C# compiler to compile the code into MSIL, using reflection to load that assembly, and finally JIT-compiling code within that assembly. I don’t need to remind you how expensive these operations can be.

A must read is “Improving .NET Application Performance and Scalability“. In addition, you can learn more about garbage collection and performance in general at Rico Mariani’s blog and Maoni Stephens’ blog.

Send your questions and comments to  clrinout@microsoft.com.


Claudio Caldato is a Program Manager for Performance and Garbage Collector in the Common Language Runtime team. A special thank you to Ashok Kamath for his performance work with startup scenarios and his precious notes I used for this column.


© 2007 Microsoft Corporation and CMP Media, LLC. All rights reserved; reproduction in part or in whole without permission is prohibited.

–jeroen

Posted in .NET, Development, Software Development | Leave a Comment »